Describe who your users are — roles, weighted tasks, a login,
think time — in YAML or in Go. surge answers the questions a load test is
usually run to answer and usually cannot.
── checkout ──  closed model · 5m
request            count   err%     rps     p50     p95     p99
────────────────────────────────────────────────────────────────
api/items         48,210   0.00   160.7    18.1    41.0    58.2
api/cart          12,604   0.11    42.0    22.4    49.9    71.3
api/checkout      12,588   2.04    42.0    31.7    88.2   141.5
────────────────────────────────────────────────────────────────
total             73,402   0.37   244.7    20.6    52.1    96.4

user actions  (end to end, think time excluded)
action              ran   failed     avg     p95     p99
checkout         12,588      257    61.4    94.6   162.0

failures  (one example of each)
  POST api/checkout        check failed      ×257
    check: json status = confirmed
    replied: {"order_id":"o-10826","status":"pending"}

thresholds
  ✓ p95(checkout) < 1s              (actual 94.6ms)
  ✗ error_rate < 1%                 (actual 2.04%)

FAIL  1 of 3 thresholds breached · 73,402 requests
  ✗ threshold error_rate < 1% — actual 2.04%
  ⚠ feeder "accounts" has 150 rows for 200 users
131krequests a second from one 12-core laptop
~3%percentile error, merged bucket-wise across machines
3dependencies: yaml, gjson, websocket
0runtimes to install — it is one binary
Write the test the way the system is shaped
YAML when the thing under test speaks HTTP or WebSocket. Go when it
speaks gRPC, SQL, a message queue or a vendor SDK — a scenario is a
program, so anything you can call, you can measure.
on_start:
  - { name: ws/connect, ws: /game, as: game }

wait: 1s..3s

flow:
  - name: ws/join
    on: game
    send: '{"op":"join","room":"${room}"}'
    receive: true               # send + receive = one round trip
    check: { body_contains: '"ok":true' }

  - name: ws/tick
    on: game
    receive: true               # on its own: the wait, which is the push
    repeat: 5
What it does that a number cannot
Every one of these exists because a load test produced a figure
somebody acted on and should not have.
A verdict with its reasons
The run opens with the finding, not the colour: which threshold broke and by how much, how many requests failed, how many checks. Underneath it, the reasons not to trust the number — a generator that ran out of CPU, arrivals that were never applied, a feeder too small for the load.
Percentiles that are percentiles
Log-linear histograms with about 3% error, merged bucket-wise across machines. Two nodes' p99 is the p99, never the average of two of them — surge prints nothing before it prints a number that is not true.
Failure evidence, not a count
Every distinct failure keeps one real example: the role, the method and URL, the status, which checks gave way and the first 512 bytes the server replied. That is what catches a checkout answering 200 with "status":"pending".
One user action, measured end to end
A checkout that is three calls is one thing the user did. Group them and surge times the journey, keeps it out of the totals so the throughput stays right, and lets a threshold name it: p95(checkout) < 1s.
Open and closed load
Closed backs off when the system slows, which is "200 people are using it". Open does not, which is the only way to see a cliff. Arrivals that find no free user are dropped and reported, so a rate you never applied cannot be read as one you did.
The protocols, not just HTTP
WebSocket in YAML and in Go, gRPC, SQL, SAP OData, TN3270 and a real browser alongside the protocol load. Anything you can call from Go is one c.Time away from the same stats, thresholds and report.
GO or NO-GO before the run
One request per target, monitor and agent: does the name resolve, is the certificate about to expire, is "staging" actually this laptop, are there enough rows in the CSV, is the metrics URL serving a login page. Thirty seconds against a two-hour run thrown away.
Capacity, searched not guessed
surge climbs until the SLO breaks, bisects the edge, then holds the answer to confirm it — because a rate that passed for eight seconds on the way up often does not survive two minutes.
A gate that knows noise
A band built from several baseline runs, not a comparison against the last one. It refuses to give a verdict on too few baselines rather than producing a confident number from two samples.
The report is the product
One self-contained HTML file: no server, no CDN, no internet. Open it
in six months and it still draws.
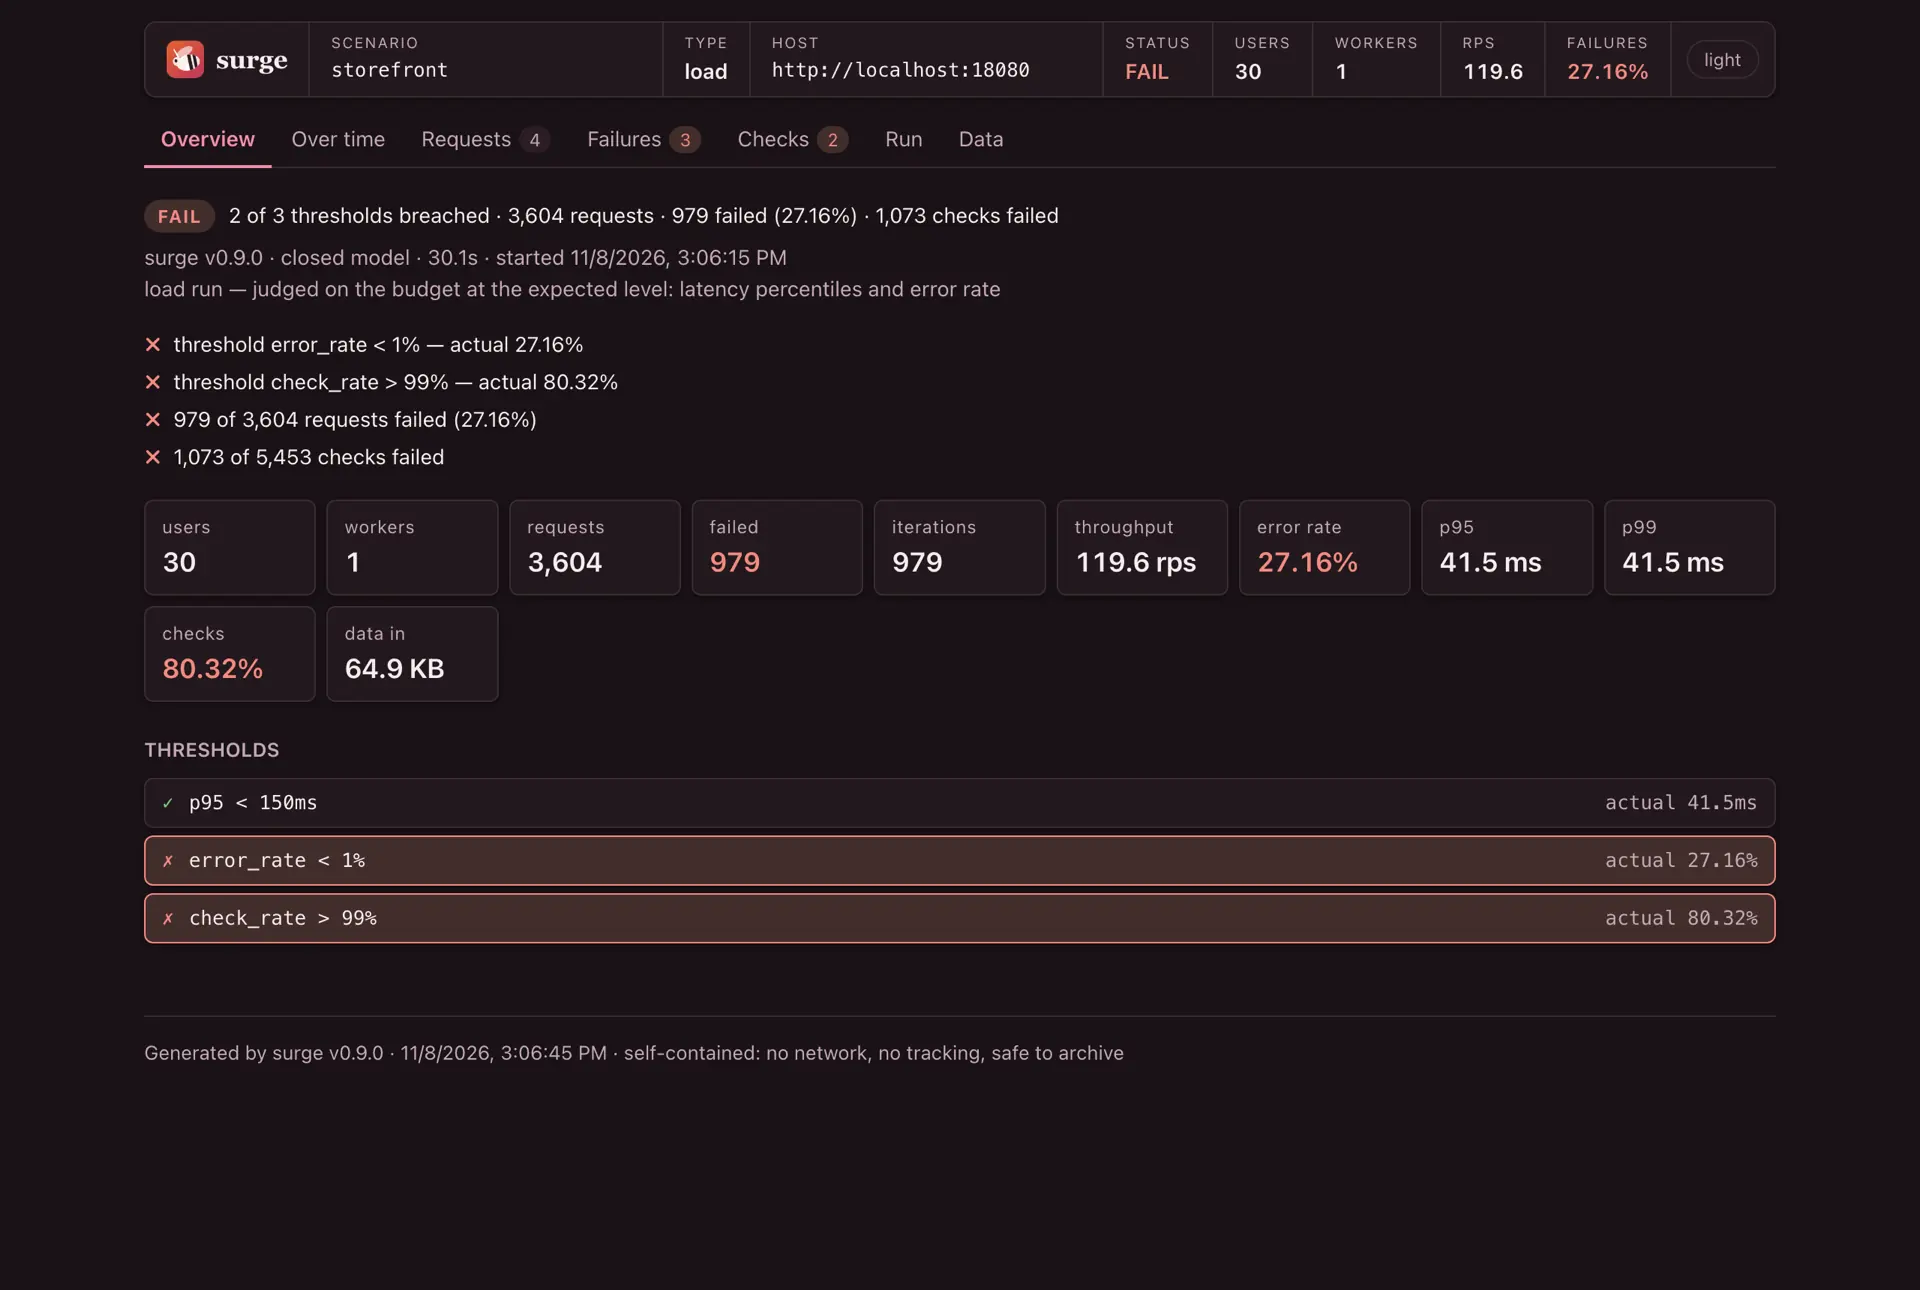
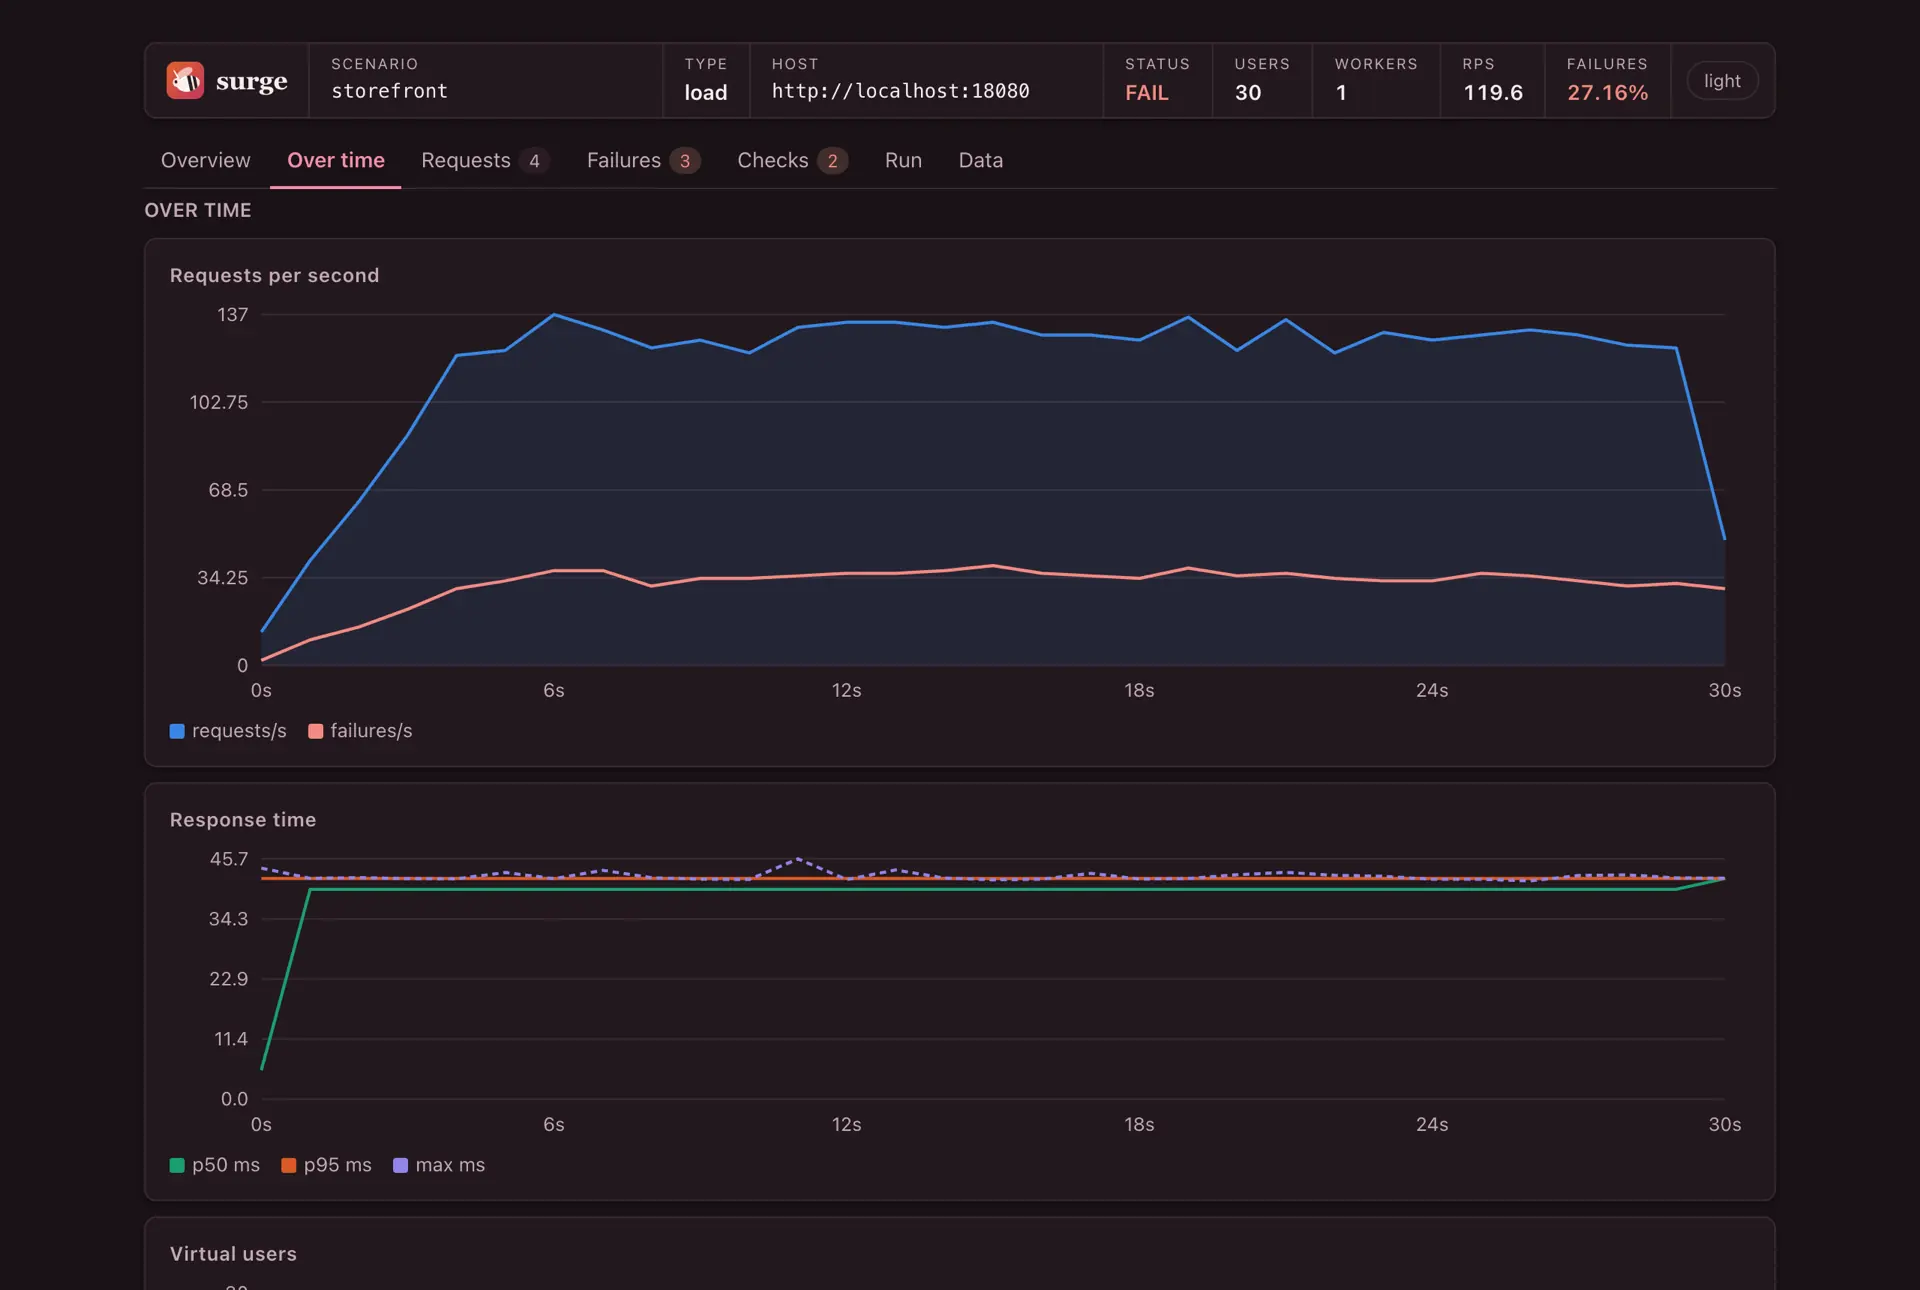
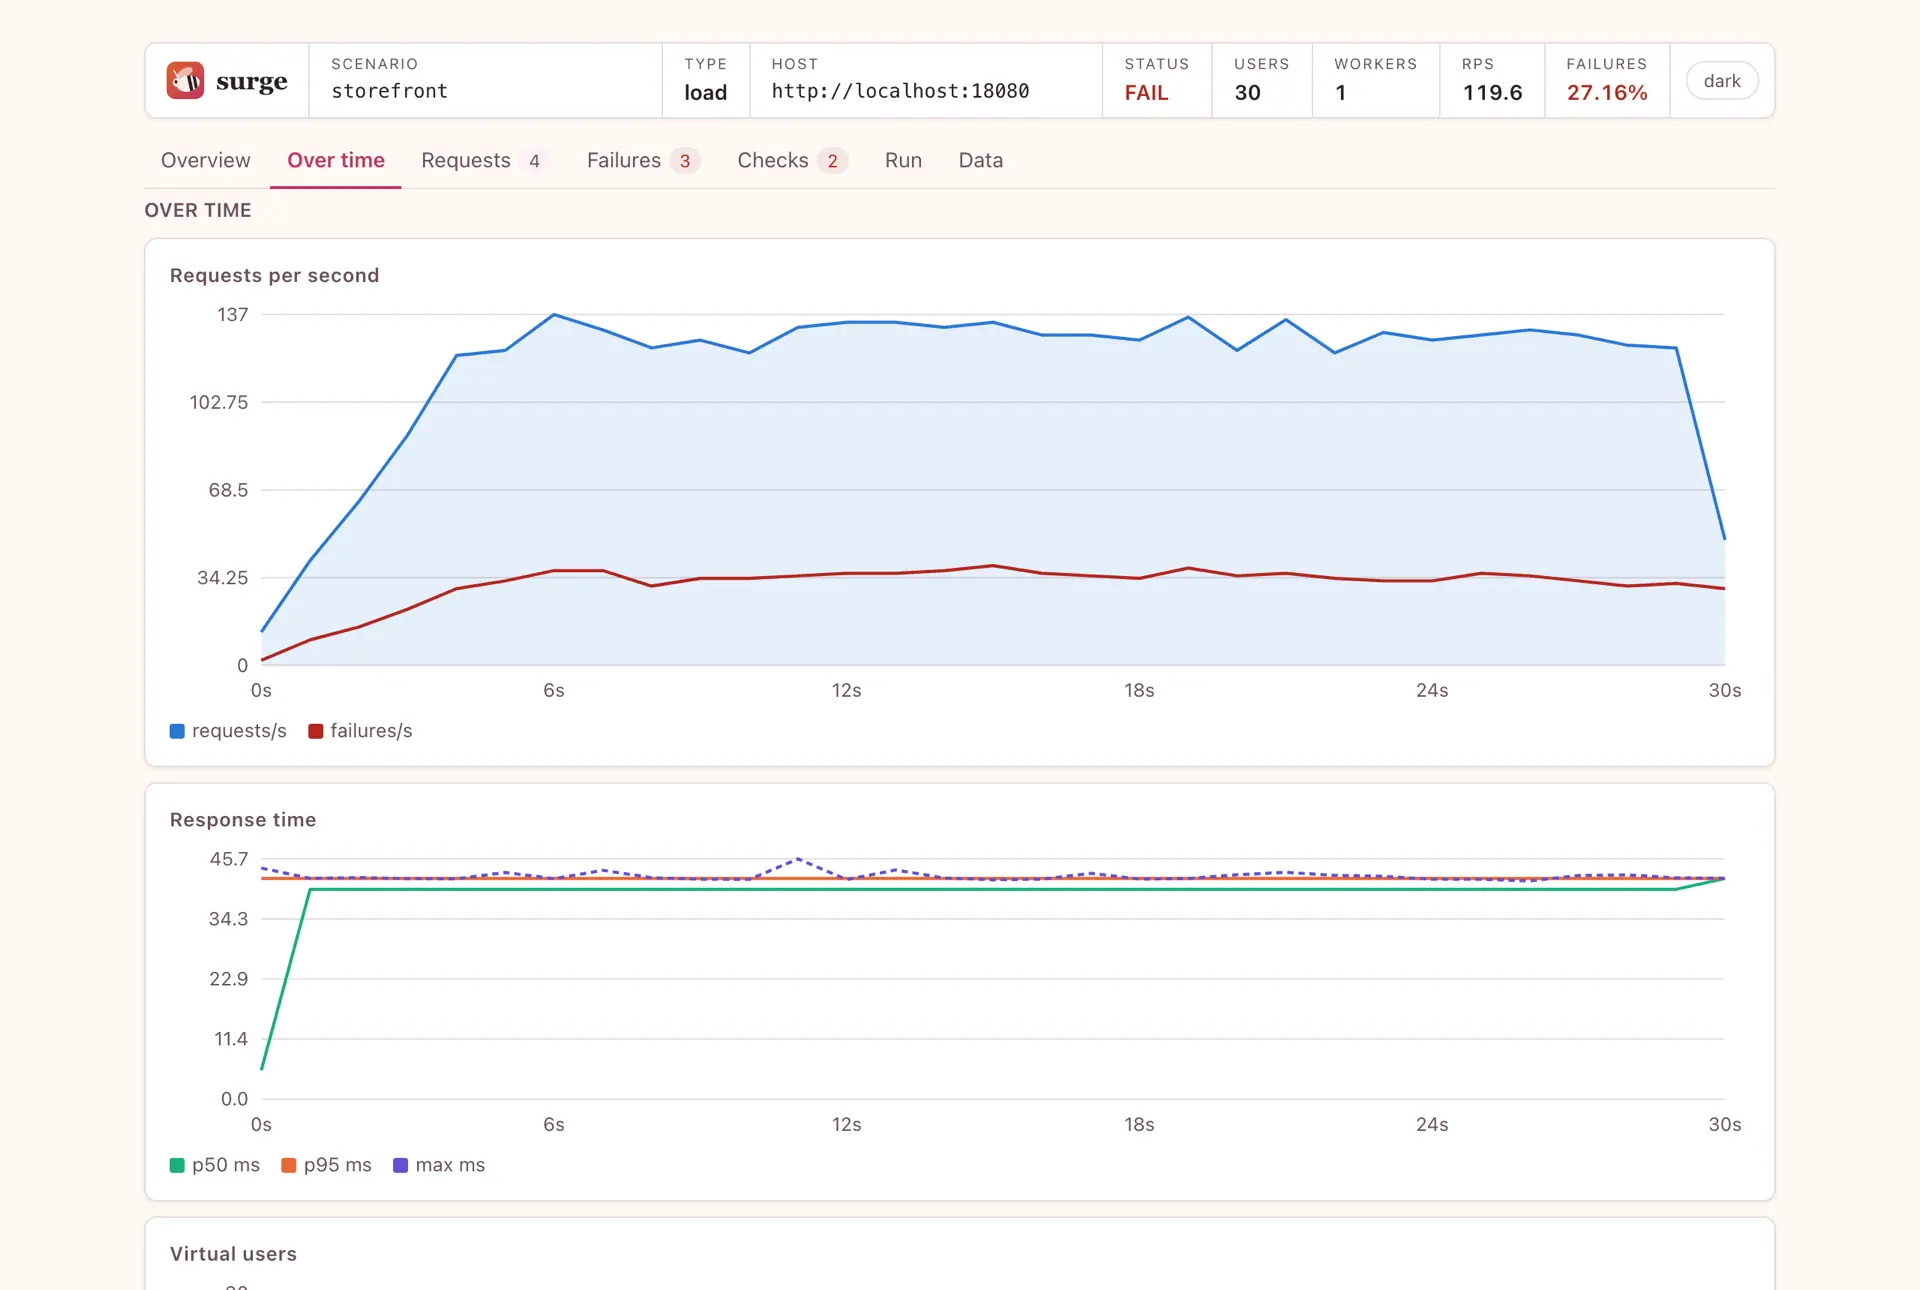
Two of three thresholds breached, and the figures they were judged on.
A pinned bar host, status, users, workers, throughput and failures, before you scroll anywhere.
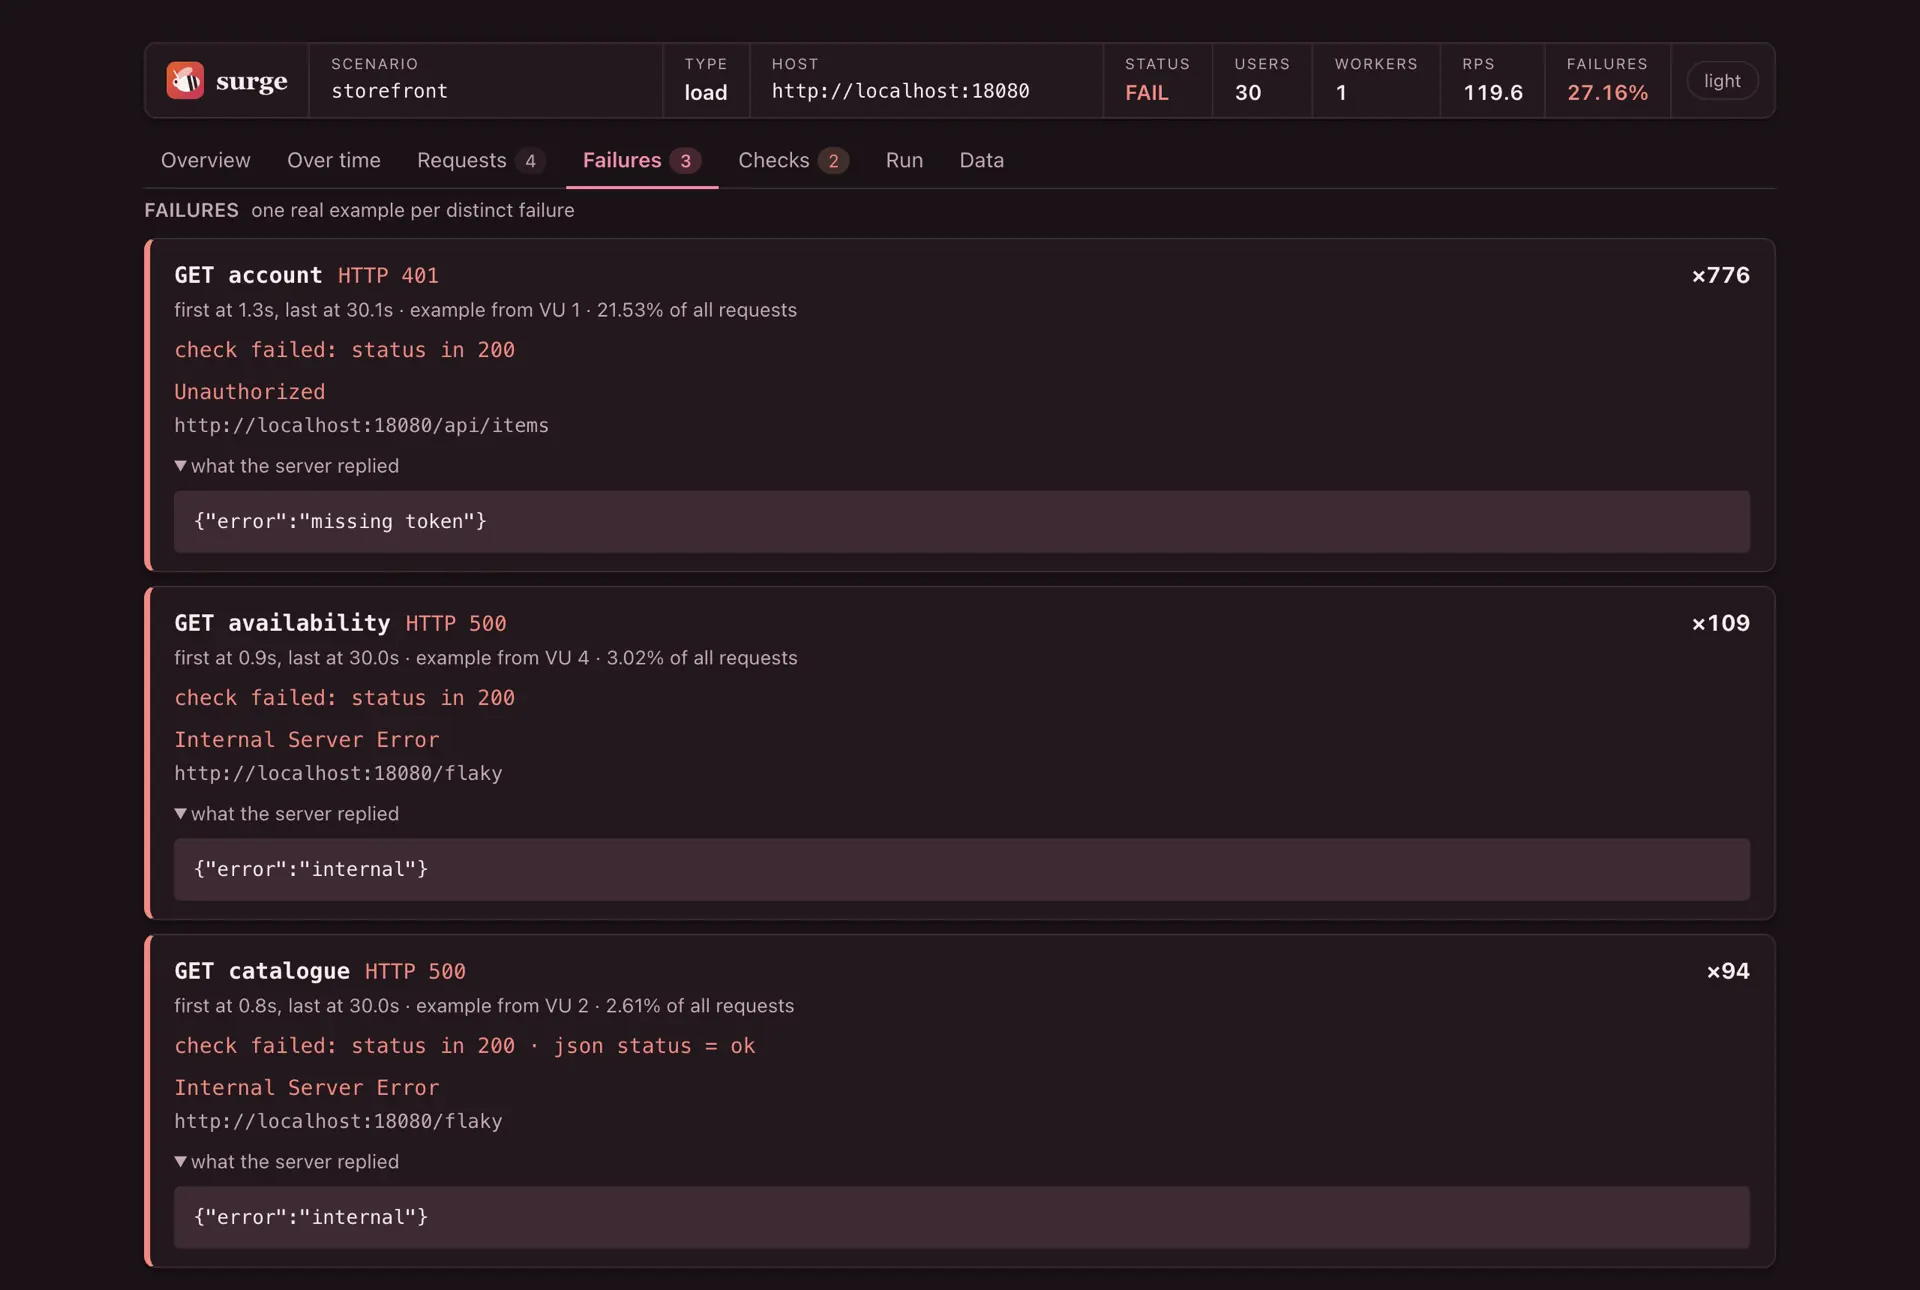
Failures with the body attached grouped by signature, one real example each, so a million failures cost the memory of fifty.
Who did the work the mix that ran against the mix you asked for — weight decides how many users pick a role, not how fast they go round.
A timestamped log every warning and abort, lined up with the charts, so "p95 climbed at 00:42" and "the generator saturated at 00:41" is one finding and not two.
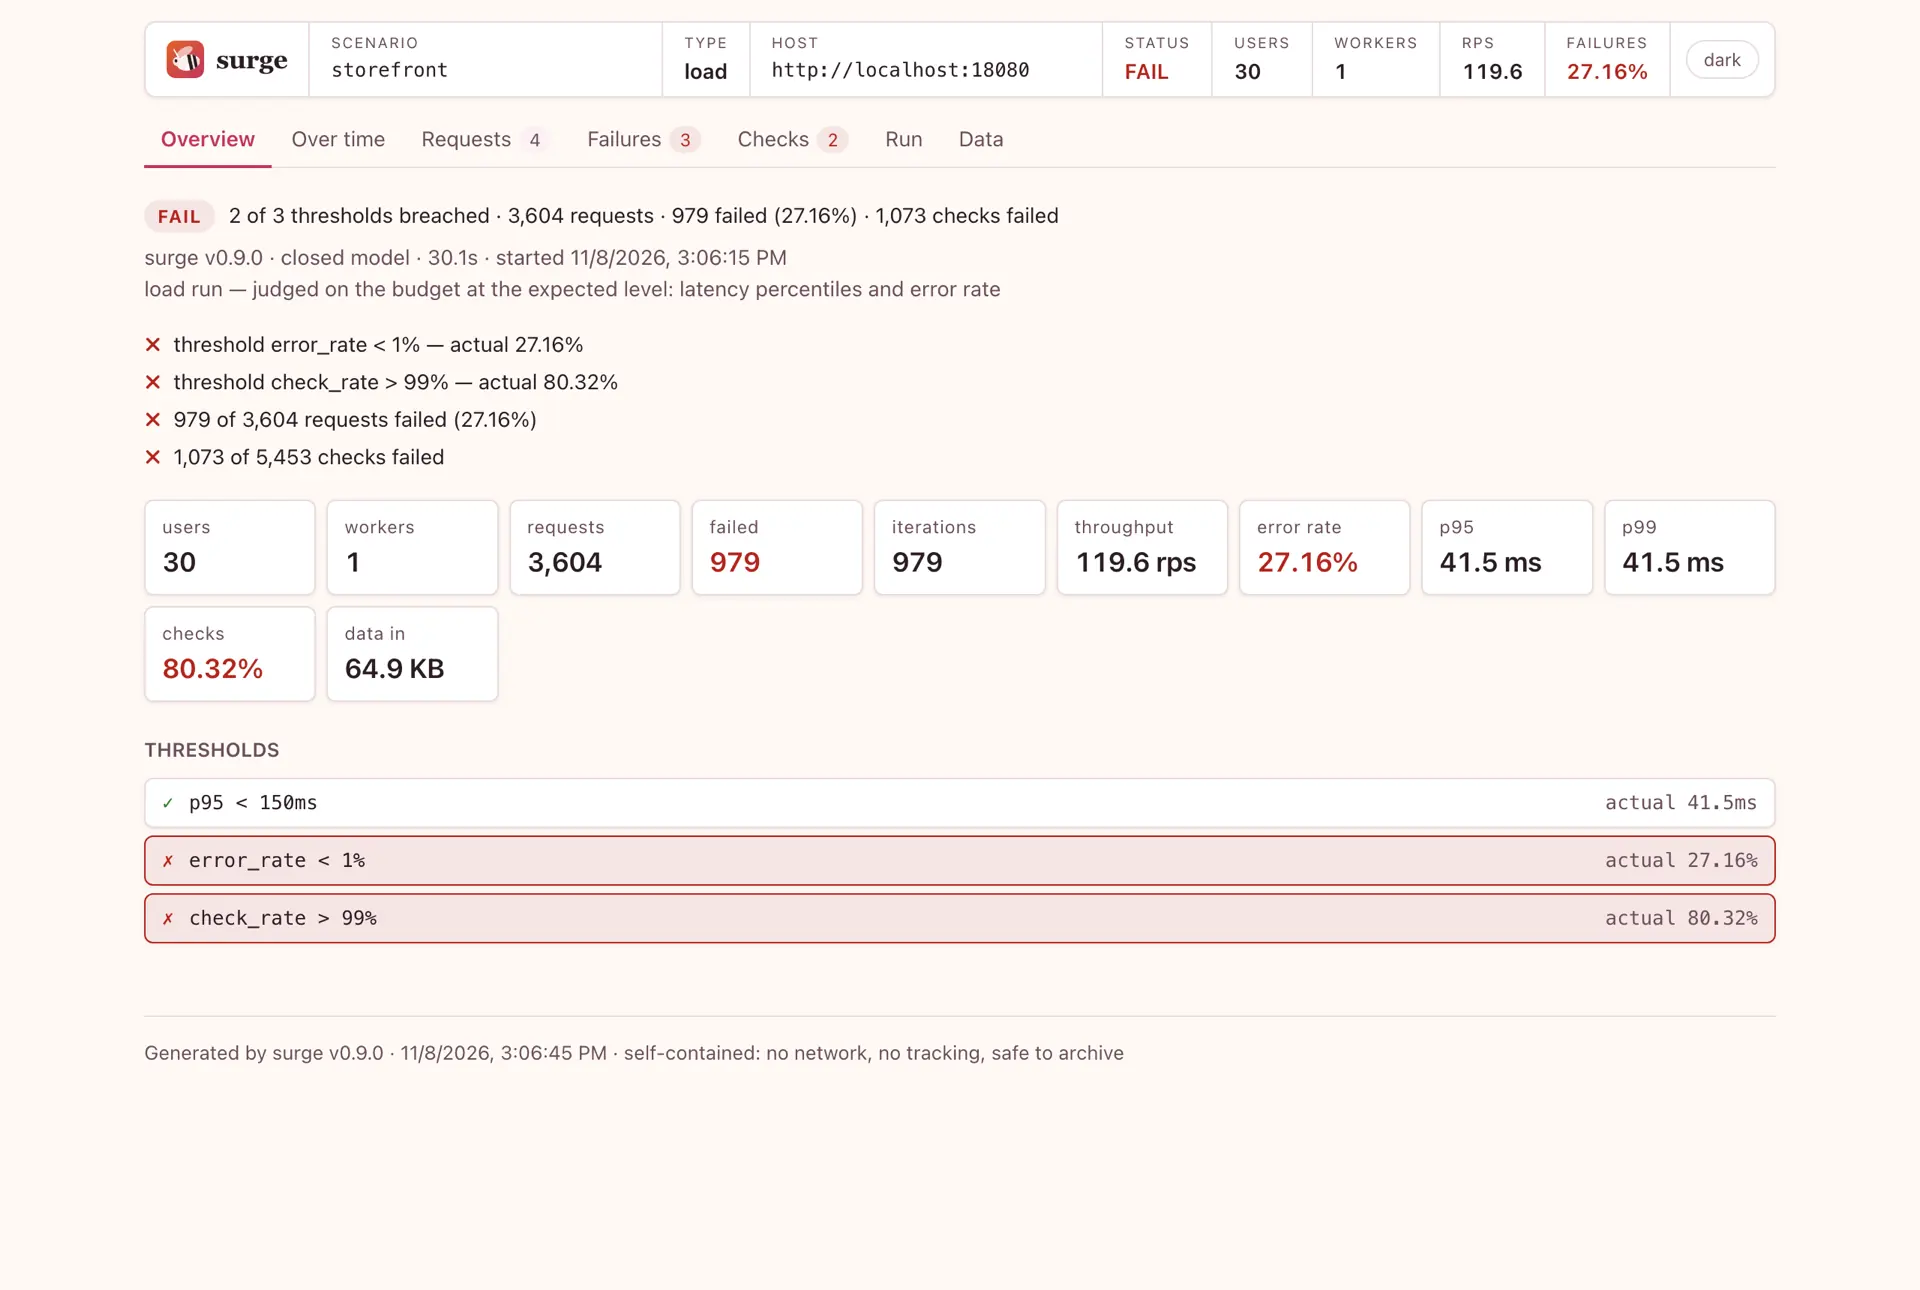
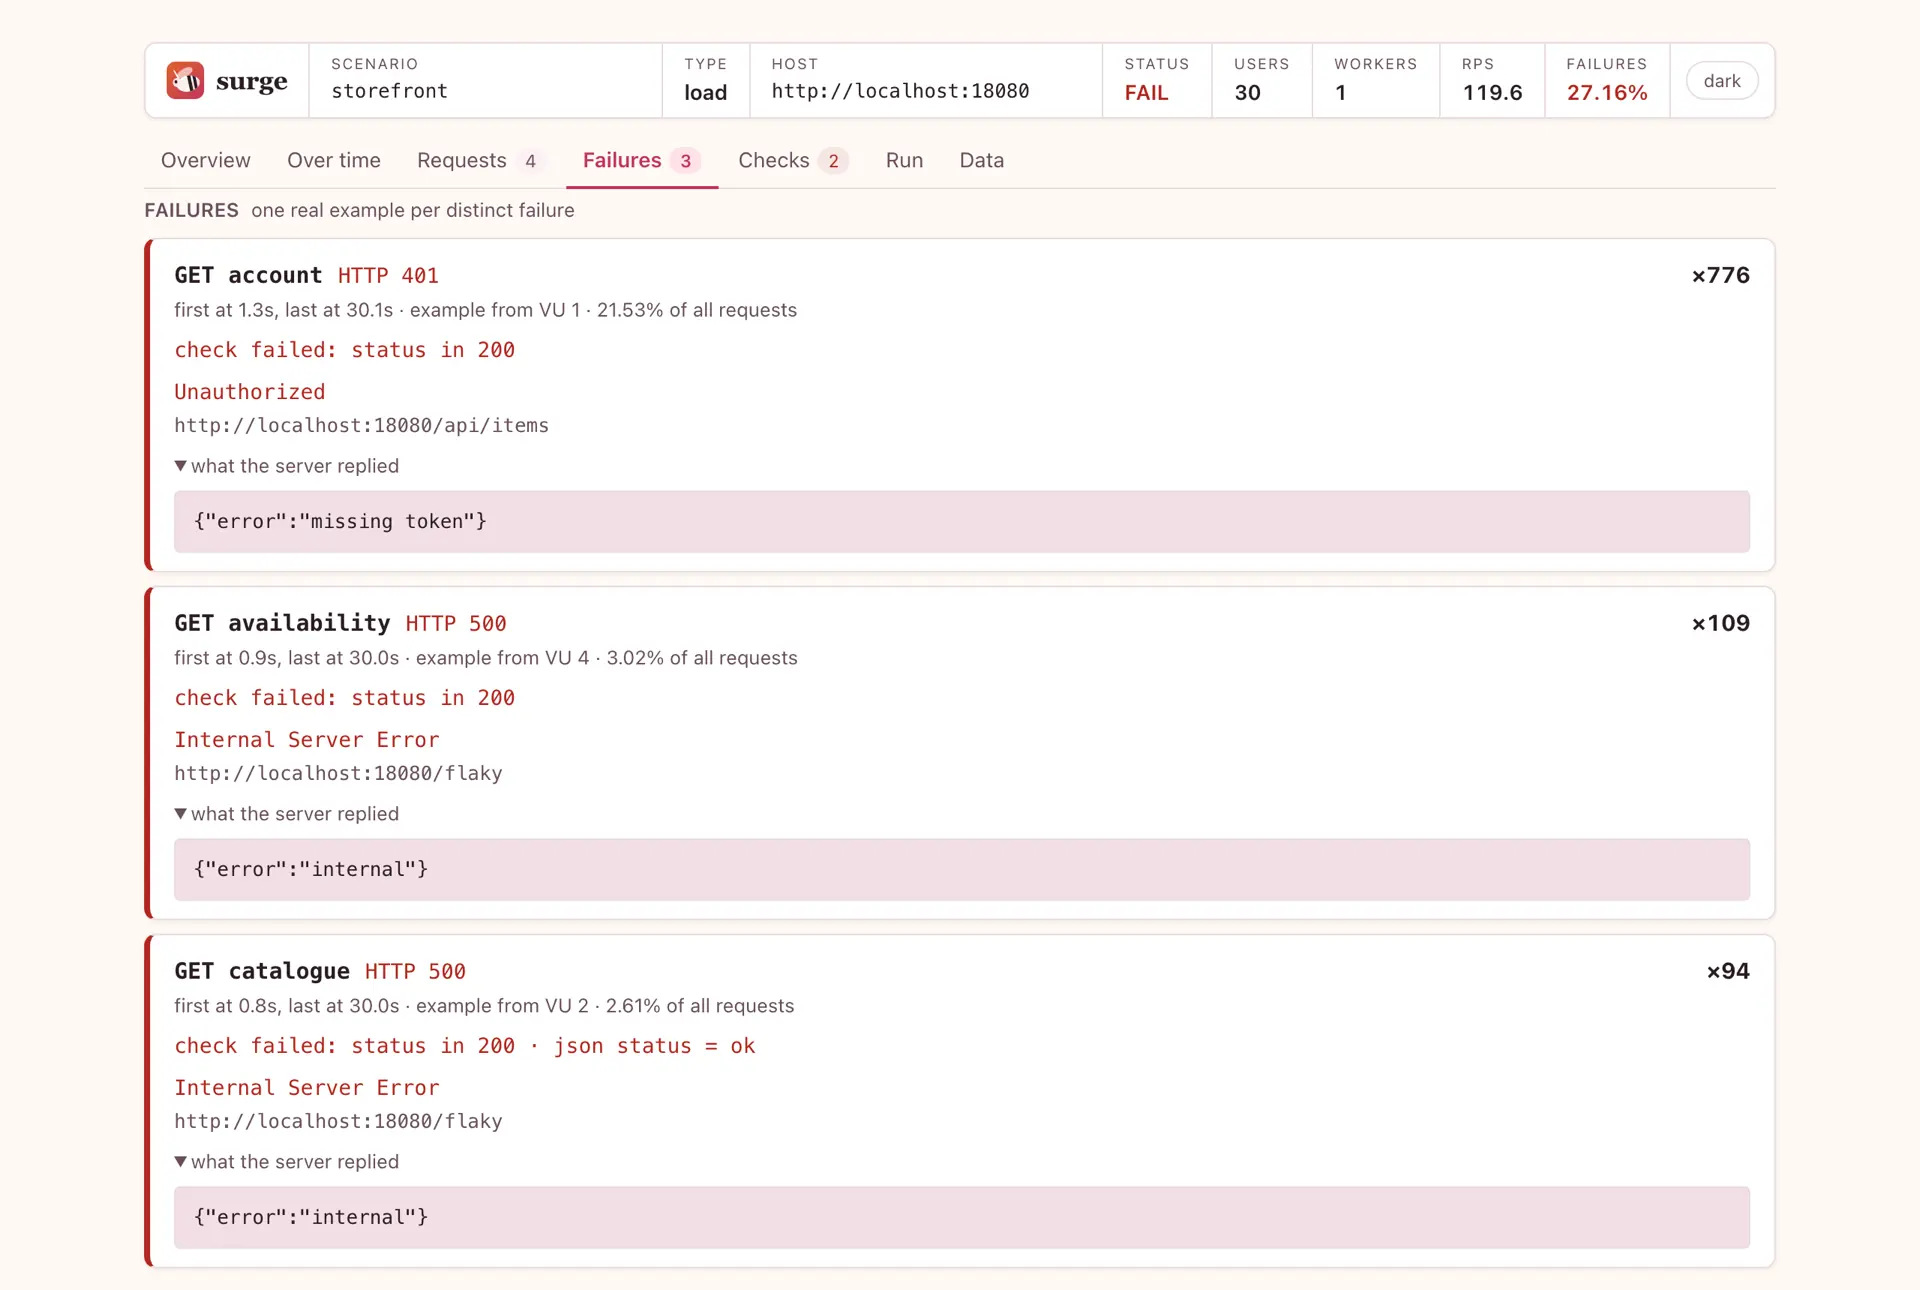
Nothing here is a mock-up the three views above are one run of the demo target that ships with surge, screenshotted as it came out.
The ⚠ lines do not change the verdict they decide whether it is worth anything — a feeder short of rows, an extract that failed, a warmup excluded.
It outlives the run no network calls, no tracking, nothing to expire: a file you can attach to a ticket and open next year.
Run it where the load has to come from
One machine
About 131,000 requests a second from a 12-core laptop — and surge
watches its own CPU and scheduling delay, marking the run untrustworthy
above 85% rather than letting you publish a number that describes the
load generator.
Several, with no coordinator
-shard 2/5 on each machine. The load and the feeder rows
are divided from the shard number alone, so two machines never hand out
the same account, then surge merge adds the raw histograms.
A fleet with one verdict
surge agent on each node, -agents a,b,c on the
coordinator. It ships the scenario and the feeder files, streams progress,
and merges the histograms into one report that still names every node.
0 pass · 1 a breached threshold or a real
regression · 2 a setup error, reported before any traffic is
sent.
Upload the report on failure too the report is the thing that explains the failure; a pipeline that throws it away on red has kept the one artefact nobody needs.
Prometheus, InfluxDB, a webhook the same run, in whatever your dashboards already read.
A Claude Code plugin six skills that read the codebase, write the scenario, rehearse it against the real system and read the result back as findings.
Sixty seconds, with nothing of your own to point it at
go run ./examples/target &     # a demo API

surge quick http://localhost:8080/health -vus 50 -duration 10s \
  -threshold "p95 < 200ms"

surge init my.yaml && surge run my.yaml -html report.html -analyze